
Bitcoin Death Cross

*Get your crypto project/offer published on this blog and news sites. Email:contact@cryptoexponentials.com
Bitcoin death cross forms when its 50 day moving average price crosses 200 moving average downward. The inverse of this is the “bitcoin gold cross”. Bitcoin death cross is a lagging indicator that reflects what happened in the past. Many a times, heavy selling leads to bitcoin death cross. But the question I am trying to answer via this blog post is, how an investor can logically react during the bitcoin death cross.
The market has recently formed the death cross on 19th June, 2021 and that totals to 7 such incidents since 2014. The data shown on the dable below, only two of the death crosses led to cumulative losses, and other four times bitcoin resulted on overall positive P/L. The 30-day and 60-day have remained the most decisive period during a Death Cross, one wherein large gains and losses have been observed.

Just by looking into the historical data above, HODL seems to a right approach during bitcoin death cross events. But unlike previous death crosses, which were primarily triggered by retail investors, the market dynamics now are different with mnay active participants including venture capital firms, market makers, hedge funds, exchnages, high frequncy traders / quants, swing traders, derivatives and opition traders, and retail traders (both long-term and newbies – Robinhood types). So it is high time to take a broader and holistic approach when it comes to responding these death crosses.
I took a look at on-chain data and pulled together few key bitcoin indicators to asses the price impact before and after death cross events to come up with a point of view on data driven approach to react to such event. Let us dive in.
Bitcoin Halving Events
Bitcoin has 4 year having cycles. Halving events will continue taking place until the reward for miners reaches 0 BTC. Since Bitcoin’s value representation has 8 decimal places, after the 33rd halving, the value of the reward will hit precisely 0 BTC. 33 halving events every 4 years adds up to 132 years total. The last Bitcoin to be mined into existence will be mined in the year 2140. It will be the 21 million’th Bitcoin to come into existence, and last, after which point it will be impossible to create anymore. From then on, Bitcoin will become truely ‘deflationary’, since “printing” / “minting” / “mining” new coins will no longer be possible, and if owners keep on losing their private keys, as they currently are, then the supply would further deflate by that lost-keys ratio. Death cross is just an event. The macro trends always suggest to HODL bitcoin and dollar cost average (DCA) for long-term gains.

Stock-To-Flow Model
Stock-to-flow ratios are used to evaluate the current stock of a commodity (total amount currently available) against the flow of new production (amount mined that specific year). For store of value (SoV) commodities like gold, platinum, or silver, a high ratio indicates that they are mostly not consumed in industrial applications. Instead, the majority is stored as a monetary hedge, thus driving up the stock-to-flow ratio. A higher ratio indicates that the commodity is increasingly scarce – and therefore more valuable as a store of value.
On the below chart price is overlaid on top of the stock-to-flow ratio line. We can see that price has continued to follow the stock-to-flow of Bitcoin over time. The theory, therefore, suggests that we can project where price may go by observing the projected stock-to-flow line. SO the next price target for Botcoin is a minimum of $100k+.

Logarithmic Growth Curves
The next metric is analyzing Bitcoin’s price timeline from a logarithmic perspective. In fact, a log price chart is one of the most popular in the world of crypto and traditional finance technical analysis. In simple terms, a crypto asset’s log chart leverages conventional percentage rates and all spacing is equivalent to scale.
Harold Christopher Burger published a comprehensive study on LGC in his paper called “Bitcoin’s natural long-term power-law corridor of growth. According to him, logarithimic price model helps people determine the market’s entry and exit points. It is estimated that the price will reach $100 000 per bitcoin no earlier than 2021 and no later than 2028. After 2028, the price will never drop below $100 000.

RHODL Ratio
RHODL Ratio looks at the ratio between RHODL band of 1 week versus the RHODL band of 1-2yrs. The Realized Value is the price of UTXO’s (coins) when they were last moved from one wallet to another.
RHODL is able to identify with great accuracy the price high of each of Bitcoin’s previous macro cycles. It identifies the market top to within a few days accuracy. This has historically been a good time for investors to take profits in each cycle. Unlike other on-chain indicators, RHODL ratio does not give a false signal of a cycle high in April 2013. This gives it a unique advantage over other on-chain indicators.
RHODL ratio entering into the red band signals that the market is approaching the top of its cycle. At present, as per RHODL ratio, Bitcoin is in HODL zone.

Bitcoin NVT Price
Willy Woo’s NVT Price values the Bitcoin network using the investor volume as seen on its blockchain. NVT Ratio is the ratio of on-chain volume to its market cap, you can think of it as a PE Ratio. NVT Price is calculated by multiplying on-chain volume by the 2 year median value of NVT Ratio, that network valuation is then adjusted to price by dividing by the coin supply. NVT Premium is simply the ratio of the market price above of below the fundamental valuation estimated by NVT Price. At present, NVT price is above the Bitcoin market price and suggesting HODL.

Spend Output Profit Ratio (SOPR)
The Spent Output Profit Ratio (SOPR) is computed by dividing the realized value (in USD) divided by the value at creation (USD) of a spent output. Or simply: price sold / price paid. SOPR help to predict bitcoin lows and tops. When SOPR > 1, it means that the owners of the spent outputs are in profit at the time of the transaction; otherwise, they are at a loss.
In a bull market, when SOPR falls below 1, people would sell at a loss, and thus be reluctant to do so. This pushes the supply down significantly, which in turn puts an upward pressure on the price, which increases. In a bear market, everyone is selling or waiting for the break-even point to sell. When SOPR is close/greater than 1, people start to sell even more, as they reach break-even. With a higher supply, the price plunges.
SOPR has fallen below 1 since 15th May 2021 and staying below 1. Any selling now would lead to the price pressure. Patience may pay off soon.

Stablecoin Ratio in USD (MACD)
This indicator is Bitcoin holdings in USD of all exchanges divided by stable coin holdings. It helps to see the potential selling pressure by looking at relative power between Bitcoin and stablecoins reserve. More supply in stablecoin markets may indicate potential buying pressure for major cryptocurrencies like Bitcoin. On the other hand, less supply in stablecoin markets may indicate the slowdown in buying pressure, which may result in potential bearish moments. Thus, this indicator usually indicates potential sell pressure.As shown on the chart below, the present ratio is indicating a potential bull run ahead.

Bitcoin Difficulty / Mining Hashpower
On June 14, the difficulty of Bitcoin mining fell 5.3% to 19.93 trillion at block height 687456. It was the first time this year that there had been two consecutive downward adjustments, and also the first time the difficulty had fallen below 20 trillion, according to BTC.com. On 21st June, difficulty is at 20.05.
There are two schools of thought. Some believe that the hashrate and difficulty follows bitcoin price. According to this dynamic, as the bitcoin price begins to rise, more and more miners get incentivized to get in on the act — effectively as speculators on the future price of bitcoin, driving up the hashpower and correspondingly the bitcoin difficulty. Others, such as Wall Street veteran Max Keiser, believe that the relationship works the other way round, that price follows hashrate (and therefore difficulty) – a correlation that has been his “mantra” since BTC was at $3.
Recent China ban on crypto mning could be causing a temporary glitch. Time to watch out Bitcoin difficulty that corelated to price point.

Futures / Options expiry – Max Pain Price
Max pain point acts as a magnet for spot prices while heading into expiration. That’s because option sellers, mostly institutions, sometimes try to push prices closer to the max pain point to inflict maximum loss on options buyers. Watch out for the max pain point for June option expiry to get a leading price indicator.

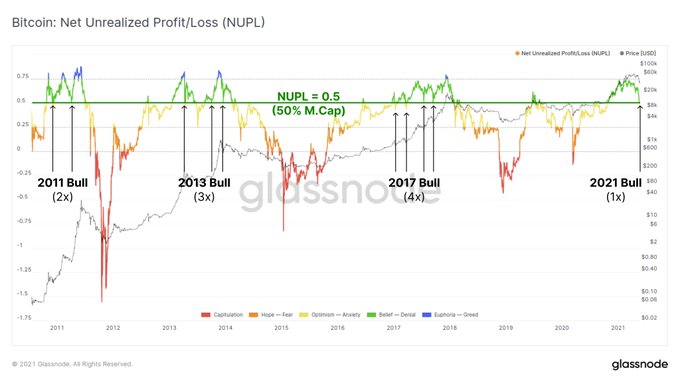
NUPL
NUPL (Net Unrealized Profit/Loss) looks at the difference between Unrealized Profit and Unrealized Loss to determine whether the network as a whole is currently in a state of profit or loss. Any value above zero indicates that the network is in a state of net profit, while values below zero indicate a state of net loss. In general, the further NUPL deviates from zero, the closer the market trends towards tops and bottoms. As such, NUPL can help investors identify when to take profit (blue) and when to re-enter (red).
NUPL is a macro cycle oscillator which tracks the magnitude of profit held in $BTC. The market is currently testing a NUPL value of 0.5 which is typical for deep bull cycle corrections.
MVRV Z-Score
MVRV Z-Score uses blockchain analysis to identify periods where Bitcoin is extremely over or undervalued relative to its ‘fair value’.
The MVRV Z-score has historically been very effective in identifying periods where market value is moving unusually high above realised value. These periods are highlighted by the z-score (red line) entering the pink box and indicates the top of market cycles. It has been able to pick the market high of each cycle to within two weeks.
It also shows when market value is far below realised value, highlighted by z-score entering the green box. Buying Bitcoin during these periods has historically produced outsized returns. As you notice in the chart below, the Z-Score is leaning to “Green Zone” and so a buy signal.

Long Term Holder Net Position Change
Glassnode data shows the bitcoin “hodler net position change,” which tracks net buying/selling activity of those holding coins for six months or more, has flipped positive for the first time since late October. Supply held by long-term holders has increased from 11 million to more than 11.6 million in the past few weeks, according to Glassnode. The net positions of BTC HODLers is a strong indicator of how longer-term investors are thinking about BTC.
While holders are now injecting bullish pressure into the market, that does not necessarily imply a sharp rally. Past data show bullish trends mostly pick up the pace after sustained accumulation by holders.

In Summary…
It is evident from the historiacal bitcoin death cross data and the current on-chain metrics that Bitcoin is HODL zone. Based on the details offered in this blog post DYOR and make a logical decision on your Bitcoin position.
Disclaimer: The opinions expressed in the Blog are for general informational purposes only and are not intended to provide specific advice or recommendations for any individual or on any specific security or investment product. It is only intended to provide education about the crypto industry.
Recommended Tools
PrimeCryptoCourse-Trade Bitcoin Like a Pro
For anyone looking to Start, Prosper and Maintain, a career in 2021, Prime Crypto Course, trains you to be a TRADER using a simplified method that will show you how to trade Bitcoin and other major cryptos, without any sophistication on advanced indicators or complex strategies. You will not need to enroll in any other training courses by taking this course. Just Digest Prime Crypto Course’s 5 Hours of Training!
SWAPP
Swapp is leading a massive movement to disrupt the $1.2T/yr data industry. For far too long, tech giants like Google and Facebook have tracked your every move, earned billions per year in monetization, but have shared none of that revenue with you, the rightful owner. Join SWAPP Now!


Comments are closed.